The Elliott Wave Principle: A Guide for Investors
- Aki Kakko

- Sep 30, 2023
- 2 min read
Updated: Mar 16, 2024
The Elliott Wave Principle is a form of technical analysis that some traders use to analyze financial market cycles and forecast market trends by identifying extremes in investor psychology, highs and lows in prices, and other collective activities. It was developed by Ralph Nelson Elliott in the late 1920s and has since been popularized by various market analysts and practitioners.

Basic Concepts:
Motive Waves and Corrective Waves: The Elliott Wave Principle states that market prices move in repetitive cycles, consisting of a 5-wave move in the direction of the main trend (known as a motive wave), followed by a 3-wave corrective move against this trend.
Fractals: Waves are fractal, meaning they can be divided into smaller sub-waves. A full 8-wave cycle consists of a 5-wave motive phase and a 3-wave corrective phase. Each of these waves can be broken down further into their own wave patterns.
The Motive Phase:
This consists of five waves, numbered 1 through 5.
Wave 1: A small rise, establishing the new trend.
Wave 2: A corrective decline but doesn’t exceed the start of Wave 1.
Wave 3: A strong and extended wave, usually the longest of the five waves.
Wave 4: Another corrective wave, which doesn’t overlap with the territory of Wave 1.
Wave 5: The final move in the direction of the main trend.
The Corrective Phase:
This consists of three waves, labeled A, B, and C.
Wave A: A decline following the 5-wave advance.
Wave B: An upward move which typically doesn’t exceed the peak of the motive phase's Wave 5.
Wave C: A final move downwards, often ending beyond where Wave A finished.
Examples of the Elliott Wave Principle:
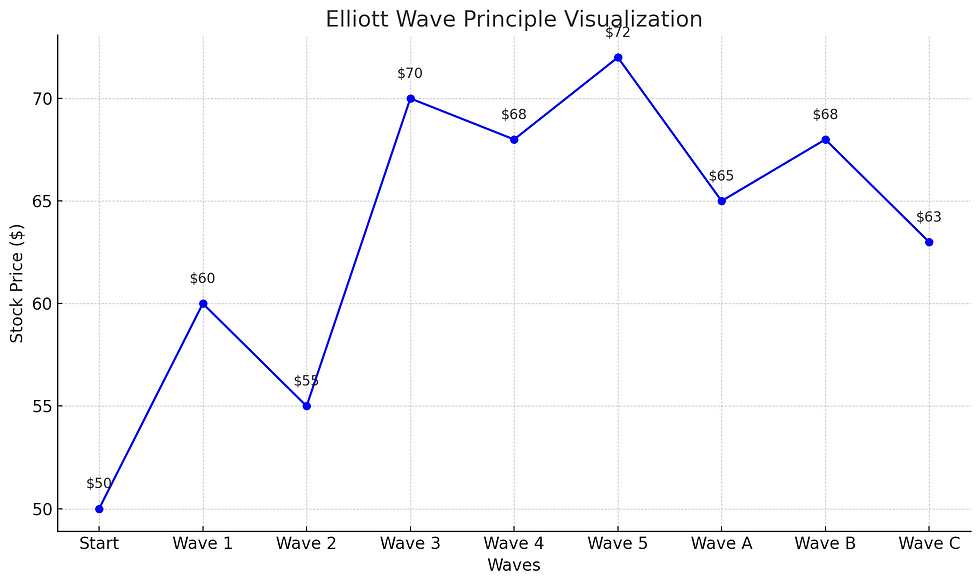
Imagine a bullish scenario in the stock market:
A stock starts at $50 and climbs to $60 in Wave 1.
It then retracts to $55 in Wave 2.
The strong Wave 3 pushes it up to $70.
A slight retraction in Wave 4 brings it down to $68.
Finally, Wave 5 pushes it to a new high at $72.
Now, the corrective phase begins:
Wave A pushes it down to $65.
Wave B sees a minor rally to $68.
And, Wave C brings it down again, possibly below $65, say to $63.

Practical Use for Investors:
Forecasting: By identifying the current wave count, investors can anticipate the next likely move in the market.
Risk Management: Knowing where you are within a wave structure can provide clarity on potential entry and exit points.
Psychological Advantage: Understanding that markets move in repetitive cycles can help investors avoid getting swayed by short-term noise and sentiment.
Limitations:
Subjectivity: Counting waves can be subjective. Different analysts might interpret wave patterns differently.
Not a Standalone Tool: For many, the Elliott Wave Principle works best when combined with other forms of technical and fundamental analysis.
While the Elliott Wave Principle offers a unique perspective on market cycles, it's essential to understand its complexities and nuances. Successful application requires practice and sometimes patience. Like all forms of analysis, it's merely a tool in the investor's toolkit, and its effectiveness can vary based on the asset being analyzed and current market conditions.


Comments